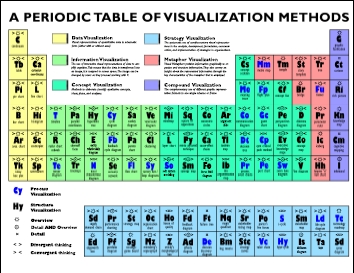
Towards A Periodic Table of Visualization Methods for ManagementRalph Lengler, Martin Jürg Eppler
Publikationsdatum:
|
 |
 Diese Seite wurde seit 6 Jahren inhaltlich nicht mehr aktualisiert. Unter Umständen ist sie nicht mehr aktuell.
 Zusammenfassungen
 In this paper, we describe the effort of defining and compiling
existing visualization methods in order to develop a
systematic overview based on the logic, look, and use of
the periodic table of elements. We first describe the current
fragmented state of the visualization field. Then we
outline the rules and criteria we applied in conducting our
research in order to present a revised periodic table of 100
visualization methods with a proposition how to use it.
 Dieser Text erwähnt ...
 Personen KB IB clear | Marco Arguedas, Edward de Bono, Alberto J. Cañas, S. Card, Roger Carff, Rodrigo Carvajal, Marco Carvalho, Chaomei Chen, Martin Jürg Eppler, Thomas Eskridge, Greg Hill, Robert E. Horn, James Lott, J. Mackinlay, Jerry Rhodes, Ben Shneiderman, Edward R. Tufte, Richard Saul Wurmann | ||||||||||||||||||||||||||||||||||||||||||||||||||||||||||||||||||||||||||||||||||||||||||||||||||||||||||||
 Begriffe KB IB clear |  Classification Classification Classification, Classification,  Daten Daten data, Informationinformation, information visualizationinformation visualization, knowledge visualizationknowledge visualization, data, Informationinformation, information visualizationinformation visualization, knowledge visualizationknowledge visualization,  Management Management management, management,  Prozess, Prozess,  Struktur Struktur structure, structure,  Visualisierung Visualisierung visualization visualization | ||||||||||||||||||||||||||||||||||||||||||||||||||||||||||||||||||||||||||||||||||||||||||||||||||||||||||||
 Bücher |
| ||||||||||||||||||||||||||||||||||||||||||||||||||||||||||||||||||||||||||||||||||||||||||||||||||||||||||||
 Texte |
|
 Tagcloud
 Einträge in Beats Blog
 Zitationsgraph
 Zeitleiste
 Volltext dieses Dokuments
 |  Towards A Periodic Table of Visualization Methods for Management: Artikel als Volltext ( Towards A Periodic Table of Visualization Methods for Management: Artikel als Volltext ( : :  , 484 kByte; , 484 kByte;  : :  2021-03-21) 2021-03-21) |
 Anderswo suchen
 Beat und dieser Text
Beat war Co-Leiter des ICT-Kompetenzzentrums TOP während er Dieser Text ins Biblionetz aufgenommen hat. Die bisher letzte Bearbeitung erfolgte während seiner Zeit am Institut für Medien und Schule. Beat besitzt kein physisches, aber ein digitales Exemplar. Eine digitale Version ist auf dem Internet verfügbar (s.o.). Es gibt bisher nur wenige Objekte im Biblionetz, die dieses Werk zitieren.


 Biblionetz-History