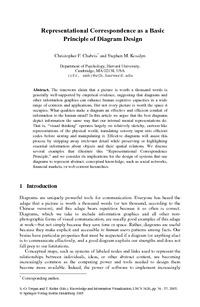
Representational Correspondence as a Basic Principle of Diagram DesignChristopher F. Chabris, Stephen M. Kosslyn
Zu finden in: Knowledge and Information Visualization (Seite 36 bis 57), 2005
|
 |
 Diese Seite wurde seit 1 Jahr inhaltlich nicht mehr aktualisiert.
Unter Umständen ist sie nicht mehr aktuell.
 Zusammenfassungen
 The timeworn claim that a picture is worth a thousand words is
generally well-supported by empirical evidence, suggesting that diagrams and
other information graphics can enhance human cognitive capacities in a wide
range of contexts and applications. But not every picture is worth the space it
occupies. What qualities make a diagram an effective and efficient conduit of
information to the human mind? In this article we argue that the best diagrams
depict information the same way that our internal mental representations do.
That is, “visual thinking” operates largely on relatively sketchy, cartoon-like
representations of the physical world, translating sensory input into efficient
codes before storing and manipulating it. Effective diagrams will assist this
process by stripping away irrelevant detail while preserving or highlighting
essential information about objects and their spatial relations. We discuss
several examples that illustrate this “Representational Correspondence
Principle,” and we consider its implications for the design of systems that use
diagrams to represent abstract, conceptual knowledge, such as social networks,
financial markets, or web content hierarchies.
 Dieser Text erwähnt ...
 Personen KB IB clear | Stephen M. Kosslyn , Edward R. Tufte | |||||||||||||||||||||||||||
 Aussagen KB IB clear | Ein Bild sagt mehr als 1000 Wortea picture says more than a thousand words | |||||||||||||||||||||||||||
 Begriffe KB IB clear |  Bilder
, social network analysissocial network analysis Bilder
, social network analysissocial network analysis
| |||||||||||||||||||||||||||
 Bücher |
|
 Zitationsgraph
 Zitationsgraph (Beta-Test mit vis.js)
 1 Erwähnungen
- Interaktive Maps - Zugriffsinstrumente auf große Textmengen (Raja Gumienny) (2007)


 Anderswo finden
 Volltext dieses Dokuments
 |  Representational Correspondence as a Basic Principle of Diagram Design: Artikel als Volltext bei Springerlink ( Representational Correspondence as a Basic Principle of Diagram Design: Artikel als Volltext bei Springerlink ( : :  , 737 kByte; , 737 kByte;  : :  Link unterbrochen? Letzte Überprüfung: 2021-03-21 Letzte erfolgreiche Überprüfung: 2019-10-11) Link unterbrochen? Letzte Überprüfung: 2021-03-21 Letzte erfolgreiche Überprüfung: 2019-10-11) |
 |  Representational Correspondence as a Basic Principle of Diagram Design: Artikel als Volltext ( Representational Correspondence as a Basic Principle of Diagram Design: Artikel als Volltext ( : :  , 737 kByte; , 737 kByte;  : :  Link unterbrochen? Letzte Überprüfung: 2020-11-28 Letzte erfolgreiche Überprüfung: 2015-05-28) Link unterbrochen? Letzte Überprüfung: 2020-11-28 Letzte erfolgreiche Überprüfung: 2015-05-28) |
 Anderswo suchen
 Beat und dieser Text
Beat war Co-Leiter des ICT-Kompetenzzentrums TOP während er Dieser Text ins Biblionetz aufgenommen hat. Die bisher letzte Bearbeitung erfolgte während seiner Zeit am Institut für Medien und Schule. Beat besitzt kein physisches, aber ein digitales Exemplar. Eine digitale Version ist auf dem Internet verfügbar (s.o.). Aufgrund der wenigen Einträge im Biblionetz scheint er es nicht wirklich gelesen zu haben. Es gibt bisher auch nur wenige Objekte im Biblionetz, die dieses Werk zitieren.


 Biblionetz-History